Exploring nonlinear inversions: A 1D magnetotelluric example
Info
- Journal: The Leading edge
- doi: 10.1190/tle36080696.1
Abstract
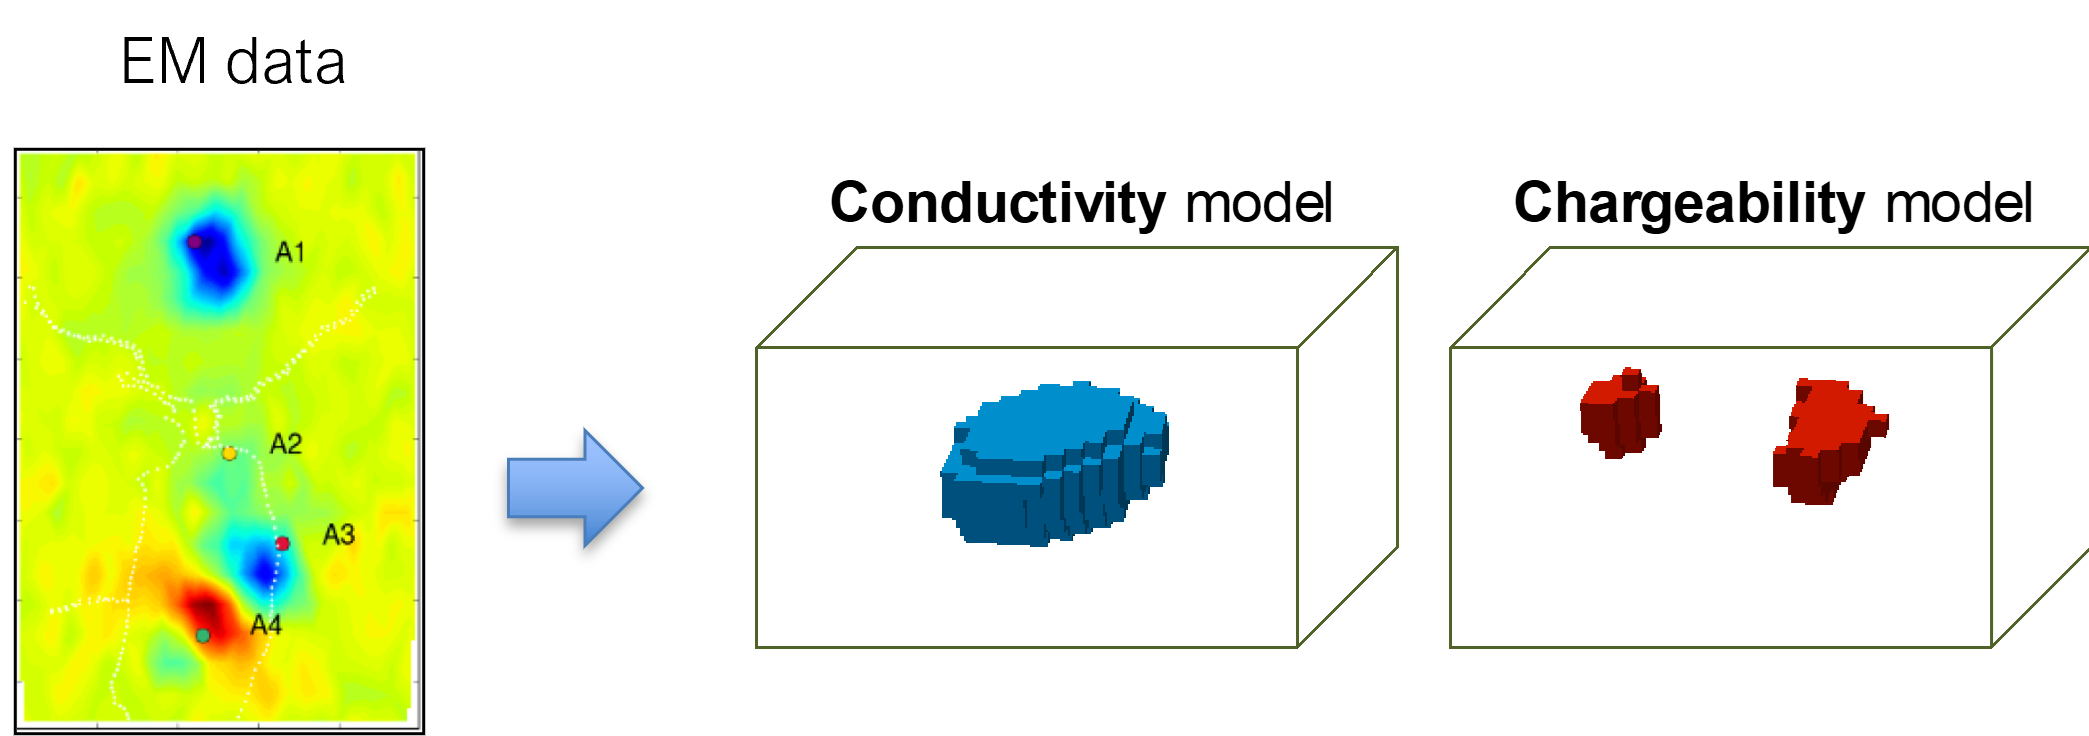
At some point in many geophysical workflows, an inversion is a necessary step for answering the geoscientific question at hand, whether it is recovering a reflectivity series from a seismic trace in a deconvolution problem, finding a susceptibility model from magnetic data, or recovering conductivity from an electromagnetic survey. This is particularly true when working with data sets where it may not even be clear how to plot the data: 3D direct current resistivity and induced polarization surveys (it is not necessarily clear how to organize data into a pseudosection) or multicomponent data, such as electromagnetic data (we can measure three spatial components of electric and/or magnetic fields through time over a range of frequencies). Inversion is a tool for translating these data into a model we can interpret. The goal of the inversion is to find a ?model? ? some description of the earth's physical properties ? that is consistent with both the data and geologic knowledge.
Citation
Kang, S., L. J. Heagy, R. Cockett, and D. W. Oldenburg, 2017, Exploring nonlinear inversions: A 1D magnetotelluric example: The Leading Edge, 36, 696–699. doi: 10.1190/tle36080696.1
